
The AI monitoring assistant exposed a scaling gap in the monitoring tool.
Users weren’t scanning dashboards anymore.
They were asking direct questions.
The system had data. It lacked decision logic to prioritize what mattered.
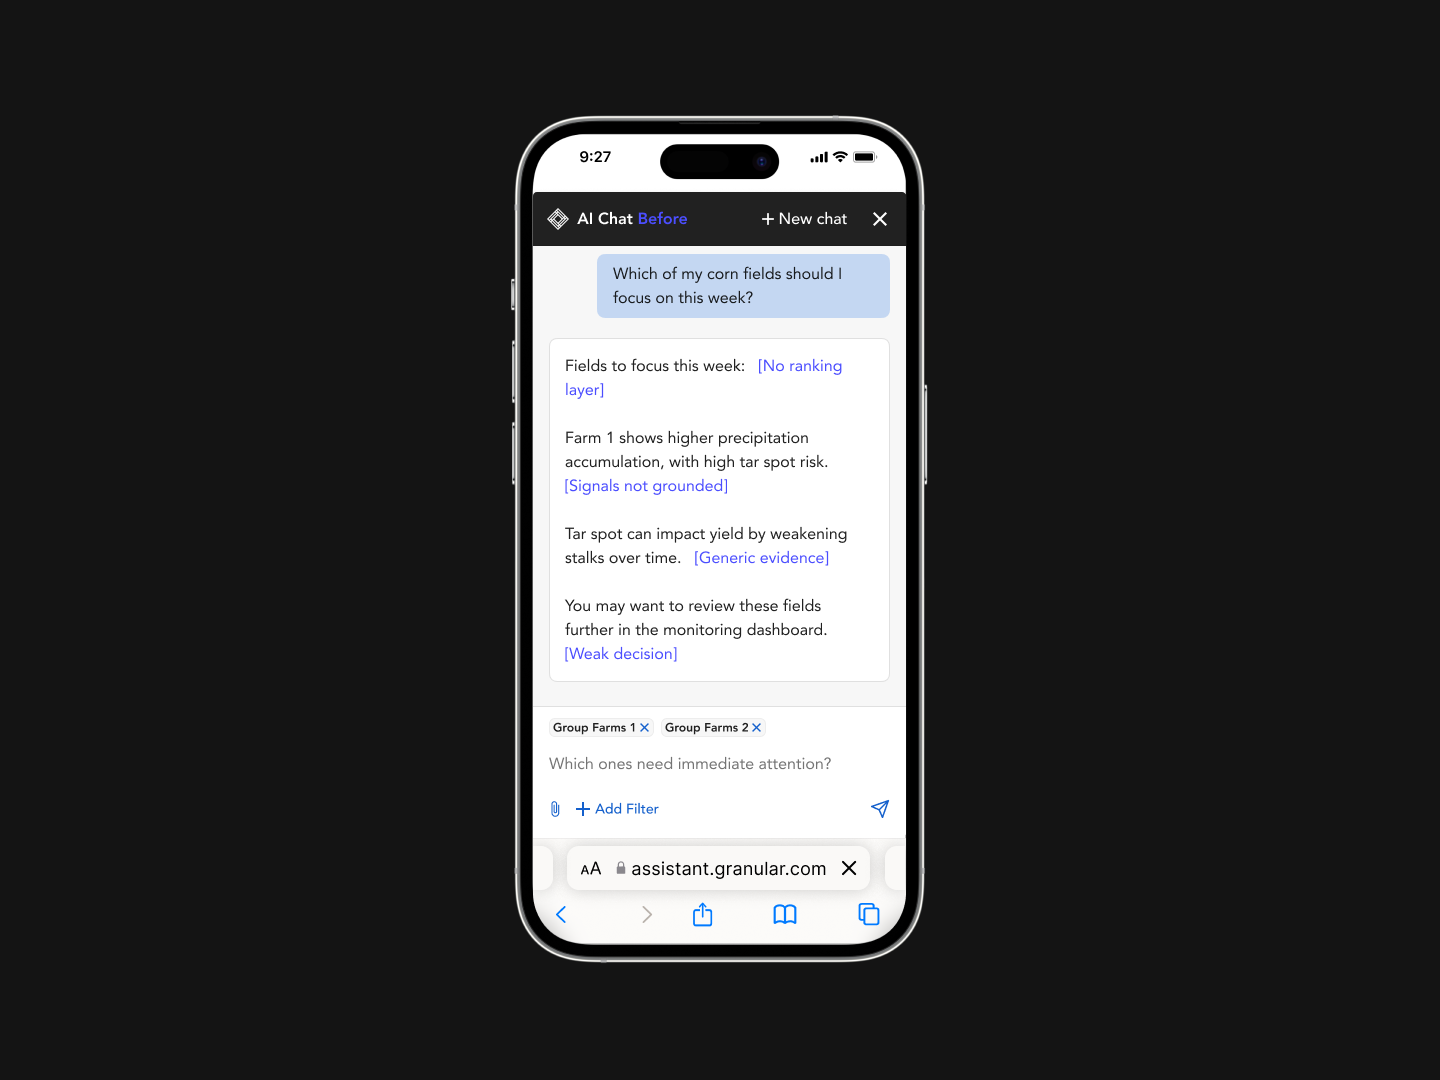
Before (Dashboard)
Multi-signal visual exploration for expert users
Behavior Shift (Chat)
Became the entry point for non-expert reps
System (What Broke)
Results varied across similar queries
Large queries hit compute limits
+ New users needed monitoring insights before they explored dashboards.
What changed in monitoring chat
Background
AI Chat for an Agriculture Monitoring Platform - conversational interface embedded in the monitoring tool
Narrow decision windows
Weather & disease uncertainty
Field-level variability
Financial stakes and Crop loss
User
One sales representative
manages 50+ farmers making decisions across 30,000+ acres.
This tool enables earlier action.
Reducing crop loss by up to 30%.
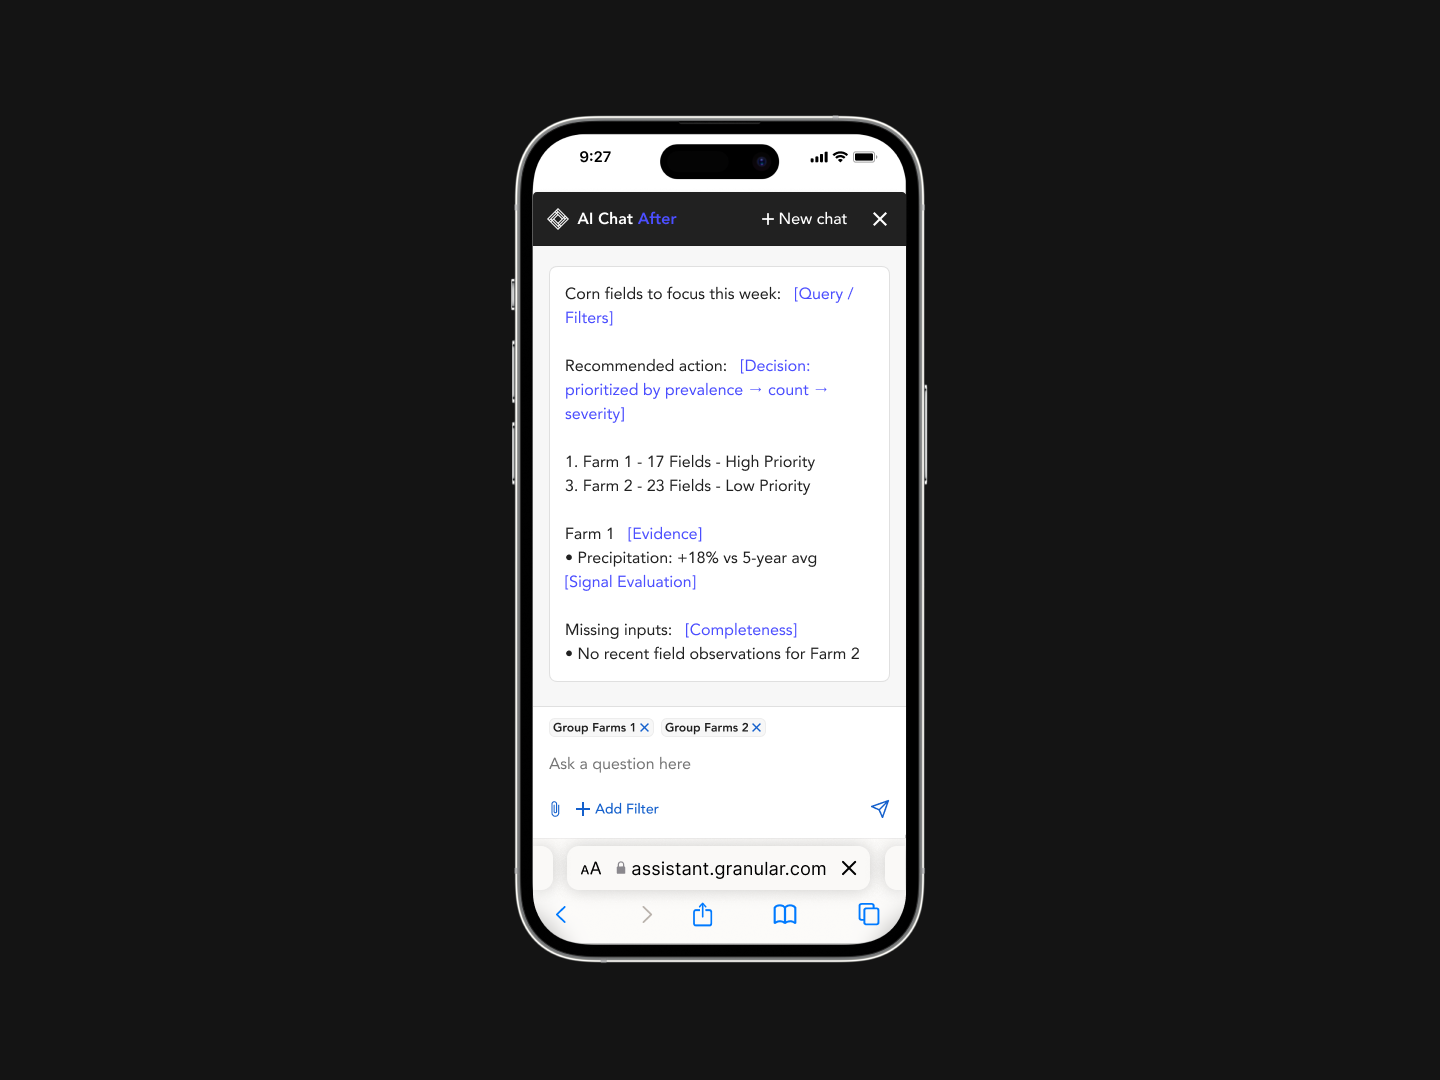
Decision logic turned chat into a reliable decision layer.
Deterministic logic was introduced so AI responses could be trusted.
Fewer clarification questions
Users needed fewer follow-ups to act on monitoring insights.
Adopted beyond the original feature
The prioritization logic was adopted by another internal tool.
+ This required system-level decisions, not just better prompts
The strategic shift
Three pressures shaped the problem space.
User needs, infrastructure limits, and AI trust requirements all pulled in different directions.
The real issue wasn’t missing insights. It was the structure between signals and responses.
+ The issue wasn’t missing data. It was missing structure.
The diagnosis
Reframing the problem as system-level pressures
User Clarity Pressure
Chat became the entry point for many new users.
Typical questions:
+ What should I focus on first today?
+ Where is precipitation behind?
Users needed direct answers. Dashboards weren’t the right surface.
Infrastructure Constraint Pressure
Large territory queries stressed the system.
+ Compute truncation
+ Aggregation mismatch across hierarchy levels
Scope was constrained for v1 due to engineering limitations.
AI Trust Pressure
Early responses revealed reliability problems.
+ Inconsistent signal prioritization
+ Hallucinated insights
Leadership escalated the issue to align on safeguards.
The model was deciding things it shouldn’t.
Without ordering logic, priorities changed across similar queries, making responses unreliable.
The system needed a decision layer before an AI layer.
+ The design problem became a ranking problem.
The decision model
Moving decision logic out of the model
Monitoring Signals
GDU, precipitation, growth stage, diseases
Decision Layer
Ranked operations, prioritized fields using decision logic
AI Chat Response
Prevalence, Count, Severity
Scenario A - Isolated Severity
1 severe field
Scenario B - Widespread Exposure
7 moderately elevated fields
Before
Scenario A ranked first
LLM ranked based on the most dramatic signal.
After
Scenario B ranked first
Ranking Logic →
Prevalence
% of fields affected within an operation
Count
Total fields affected
Severity
Intensity of deviation within a field
Scenario A
Low (1/16 fields)
Low (1 field)
High (severe spike)
Scenario B
High (7/16 fields)
High (7 fields)
Medium (moderate deviation)
Why it matters for users -
Widespread impact signals an emerging operation-level problem.
It increases the risk of coordinated crop stress and yield loss, where intervention becomes necessary—not just monitoring.
With limited time, reps prioritize actions that change outcomes at scale.
Deterministic ranking defined what matters first.
+ Exposure outweighs anomaly when prioritizing risk at scale.
Designing under constraints
Signal Reliability
Model outputs varied across regions, making ranking inconsistent.
Data science
Compute limits
Large-scale queries frequently failed with “too much to compute.”
System architecture
New user entry
New users didn’t know what to look for, so they asked generic questions.
User behavior
Leadership direction
Hallucinations raised concerns about trust in AI outputs.
Strategic alignment
Reusable AI pattern
The approach needed to scale beyond a single tool.
Platform thinking
Shipping Reality
The system had to fit existing pipelines and timelines.
Delivery constraints
Translating pressures into system decisions
+ We didn’t design a response. We defined how decisions are made.
View execution
Decision Architecture for Monitoring AI
Query Layer
Shapes the request before computation
Query + Filters: field / operation / agency, growth stage
Decision Layer
Turns signals into ranked priorities
Field-Level Data: Planting date, Weather
Deterministic Classification: Assigns Elevated / Stable / Insufficient states
Operation Ranking: Prevalence → Count → Severity
Response Layer
Turns decisions into explainable output
Structured Response: Formats overview, rankings, signals, top fields
LLM Explanation
User: Which operations need attention?
Before

After

+ Ranked operations with structured signal breakdown.
+ Decision-ready output without additional follow-ups.
Separating decision logic from AI behavior
+ These decisions changed how users reached and acted on insights.
See the impact
Behavior changed. Decisions got faster.
Measured through interaction patterns and post-launch usage shifts.
Fewer follow-ups per query
Users reached decisions with fewer prompts
Most monitoring queries resolved in a single response
Increased monitoring usage in chat
Shift from product questions → decision queries
More users engaging with monitoring insights
+ The system didn’t change the data. It changed how users acted on it.
How this scaled across tools
Where I Added Leverage
Deterministic decision engine
Moved ranking out of the LLM and defined evaluation order for stable, defensible outputs
Replaced anomaly-first ranking with how farming decisions actually scale.
AI reliability & guardrails
Surfaced hallucinations to leadership and restricted responses to verified signals.
Defined compute-aware outputs using “top fields + operations” instead of full datasets.
Negotiated model scope
Defined “good output” with PM, Eng, Data, and Commercial
Pushed back on some data science models due to inconsistent accuracy and to ship weather-first.
Scoped features by feasibility, removing non-critical signals for a stable first release
New user adoption strategy
Shifted output from information → prioritized action (chat as primary decision layer for new users)
Across-verticals alignment
Defined reusable response structure across hierarchy levels enabling cross-team adoption
A reusable decision layer for AI products
Each tool had different needs. The system adapted without redesign.
Designing for AI isn’t about generating answers.
It’s about structuring decisions.
+ The structure stayed constant. The logic adapted.
Query Layer
Decision Layer
Response Layer
Monitoring (Our tool)
Growth stage
View level
Weather check
Risk priority
Overview
Key fields
Signal drivers
Fungicide (closely matching tool)
Crop type
Timing window
Disease risk
Action timing
Next action
Risk reason
Products (different suite)
Product mix
Field group
Not needed
Plan output
Expected impact
+2 tools till now
Custom filters
Custom logic
Structured output